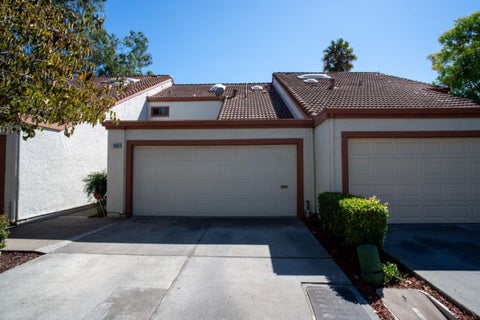
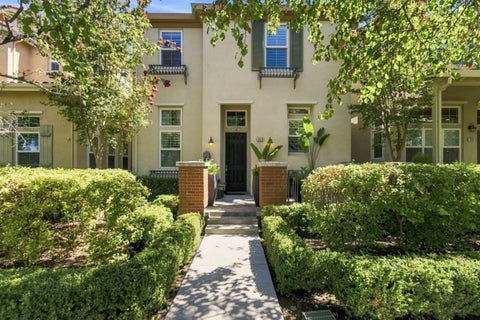
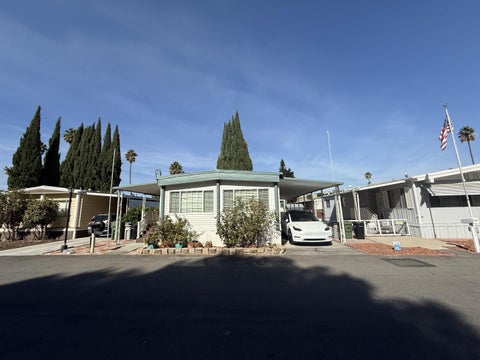
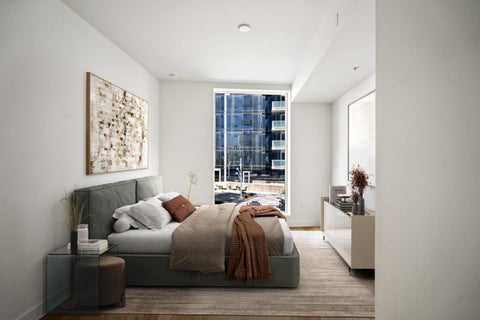
Silver Leaf Park in the Santa Teresa area of San Jose
How’s the Santa Teresa real estate market? The scenic Santa Teresa area of San Jose is popular as it’s a bit more affordable, offering lovely views of the hills and public schools that seem to be improving over time, making the area more desirable. These positives appear to be helping that district hold its value well. Here are a few details from the latest monthly market update for Santa Teresa single family homes (read the full analysis below):
Inventory rose a hair from the last month, but was below half of what it was this time last year for single family homes. In the condo and townhouse market, however, inventory has remained fairly consistent with slight growth month-to-month and year-over-year.
Closed sales grew and pending sales held stable month-to-month in the single family home market, and both have barely budged year-over-year. For condos and townhomes, closed sales held stable while pending sales shrank from the month before, both falling short of this time last year.
The sale to list price ratio skyrocketed, however that might in part be due to limited sales causing major swings (like the -5.4% drop we saw here last month) for market data. Both parts of the market are now averaging over list price, with single family home sales averaging 103.9% of asking. Both markets are also up year-over-year.
The average time on market sped up, now under a month for both sectors. t
To begin our analysis below, we have some live data feeds organized by zip code.
Santa Teresa (our MLS Area 2) includes a small bit of the 95123 zip code, which tends to be more expensive, but most of that zip code is Blossom Valley, so we will omit it. The 95138 zip code is about half Santa Teresa and half Evergreen (more expensive area), so take those numbers with a big grain of salt. I find the 95119 zip code to be most helpful, but even then, the school district is divided between Oak Grove and Morgan Hill. Take all of this data with a pound of salt, and remember that these micro markets can have a big impact!
Weekly update from Altos Research with a “market profile” of San Jose’s Santa Teresa area, zip code 95119 for single family homes / houses:
When there’s not enough data, the fields will be blank. Click any of these tables to go to the full report.
What are real estate bidding wars, and why have they been happening in Silicon Valley?
First, let’s explain what it is. Bidding wars happen when multiple home buyers overbid a property that’s on the market and make increasingly stronger offers (improving price and terms) until one of them is accepted by the home owner and the bidding is over. Sometimes home buyers get a counter offer, but return their response with even more than the seller requested. At other times, they may not even wait for a counter offer – but up their contract’s purchase price or adjust the terms to make it more desirable to the seller.
Why does this happen? It is a supply and demand issue. When there’s not enough supply for the demand, buyers feel desperate – especially if they have offered on many homes and been rejected each time. With multiple offers, prices get pushed up – and sometimes up and up while the sellers are still reviewing the contracts in front of them. The process is accelerated (or exacerbated) when multiple offers also become bidding wars.
Digging deeper with bidding wars
When a lot of home buyers want the same property and write purchase offers for it, we have multiple offers. In some markets, multiple offers come in at or under list price (I have seen this in cooler markets, though not for many years). But when the realty market is an overheated seller’s market, inventory is too low for the demand, prices rise with those multiple bids. Additionally, the terms get so aggressive that buyers often have few, if any, rights. Remember, it’s always price AND terms – so things like cash versus a loan, larger downpayments, shorter or no contingencies, and things like free rent backs will also impact the outcome. It is not only price! When the offer process escalates, we have bidding wars. (more…)
Hearing the real estate market “war stories” about dozens of offers on Silicon Valley properties and overbids ranging from 20 – 55% had convinced me that we were in a Silicon Valley real estate market bubble back in early 2013. At least, this is what a bubble looks like, sounds like, feels like, and acts like. At the time I thought, “how much longer could this continue?” Four years and counting – that is the answer.
I tell my family and friends that we are in “crazyland” as buyers purchase homes with no contingencies of any kind, houses sell in 10 days or less (if everything is right, which seems to be the case 75% of the time), and those same properties are selling at well over list price and with much more than 20% down.
The absorption rate, or months of inventory: it is a Silicon Valley real estate market bubble?
What do the numbers say? I just logged into MLSListings.com and see that right now, in all of Santa Clara County there are 817 single family homes (houses + duet or attached single family homes). The pending and contingent homes measure 1074, far more! That ratio alone suggests that the market is in overdrive. In the last 30 days, 950 single family homes have sold & closed escrow. So the months of inventory is 817 divided by 950 = .86 of a month of inventory, so about 3.5 weeks of inventory. (When I originally blogged about the potential bubble, it was 1.8 months of inventory.)
In other words, things are flying off the shelves. And they have been, with only a few minor blips here and there, since early 2012. Does that sound like a Silicon Valley real estate market bubble to you – a crazy strong seller’s market lasting 4.5 years? I could be wrong, but I think of bubbles as being something fairly swift, not a multi year trend.
Homes are selling faster than new ones are coming onto the market!
It’s one thing to say that one city, town, or school district has a very low months of inventory (or high absorption rate). It is another altogether to say an entire county is that low. This is a major trend, not a tiny blip in the statistics.
How soon we forget that after the outrageously deep seller’s market in 2000, we had a steep drop in 2001. Or that all the crazy buying in the San Jose area (and other places) in 2005-06, combined with bad financial regulations, lead to the crash of 2007-2009. But perhaps that enormous “correction”, in which Santa Clara County lost about 50% of its value on average, had more room to recover than we initially realized. Jobs keep flowing in, and housing starts are not keeping up. Supply and demand – the age old equation. That would seem to refute the idea that this is a Silicon Valley real estate market bubble. Perhaps low inventory and strong demand are what we should be expecting going forward. (more…)
Often the Silicon Valley real estate market takes a bit of a nosedive in December and January, only to make a comeback after the SuperBowl. Just now I ran the stats for the city of San Jose, which is big enough, at about 1 million people, to provide a good sense of the market generally.
Below please find a simple chart reflecting houses sold with the days on market and sale price to list price ratio. You can see, clearly, that the SP to LP ratio dips noticeably in December & January, and also that the days on market rise.
Even so, how bad was it? The average DOM was 38 (break-neck speed in any other part of the country) and the average SP to LP ratio fell to “only” 102%.
That was it – that was the “break” that buyers get in winter. Things are reversing course, as often they do in February, March, and April, and multiple offers with big overbids are again the major story in San Jose and throughout the Silicon Valley region. Just this last week I heard of a home in this valley that got 45 offers.
Home buyers, want to purchase this year? Your best bet is to be financially well equiped with 25% down or more if you are buying in any of the hotter areas. This is a nearly impossible market for FHA home buyers or for those with less than 20% down.
Home owners, want to sell this year? You can maximize your return by doing smart fixes and thorough inspections to make buyers feel confident about purchasing your property. That confidence can change the game and bring 10 offers where there might have been 5, and with the larger numbers of bidders usually there come also much larger sale prices.
Call me or email me if you would like to discuss working together and getting your best deal in the current Santa Clara County realty market.
Although some properties are not selling within 10 days, many Silicon Valley homes listed for sale do go pending a week to ten days later with multiple offers. Of those which sell quickly, pending sale prices are often far above the list price; we are seeing 10% overbids often, and sometimes 25% or more, in select cases.
Unfortunately, Bay Area many home buyers’ expectations have not yet caught up to the reality of the overheated market and are shocked that a great “full price offer” may well be the worst of the contracts presented.
What’s causing this to happen?
First, there’s a very dire shortage of homes to buy. That can create a buying frenzy all by itself in an area where people are well employed and want to put down roots.
Second, the listed prices are placed strategically low to attract multiple offers. If you were to look at the list price as opposed to the comps’ sale prices, you’d see that homes are not listed where they should sell, but often about 5% below that amount in many cases (sometimes more than 10% lower, though).
It is extremely important to realize that the list price may have little to do with the eventual purchase price. Study the comps and then assume a trajectory. If homes are going up at the rate of $10,000 per month for the type of home you like, then when you bid, consider the sale price 30 days out – or more – and then you may hit the target.
You’re selling your Silicon Valley home, and your real estate agent just informed you that you have not one, but several offers coming in. Joy! What should you expect in the way of prices being offered? Today we will discuss what can, and often does, happen.
(1) All in a fairly tight range of pricing: Sometimes, the bids all come in at about the same value or within a small range. For instance, let’s say your house is listed for $900,000 and you get four offers. In this case, the bids could be at $920,000 and $925,000 plus two more at $930,000. These are all pretty close to one another. The terms could be different, though. Perhaps the lowest one is all cash. Maybe the middle one has no contingencies. You get the idea. In any event, when you see that “band” of pricing, it’s a pretty good indicator of where true market value is.
It should be noted that in some markets, multiple offers are not over list price. This can be a factor of the market conditions at the time (such as a declining market) or a reflection that willing and able buyers simply find the list price to be too high. Do not assume that multiple offers will always be over list price (though at this writing, virtually all are). When the offers are similar, the terms or even little things can make a difference (who wrote a letter to the seller? who was a pest at the open house, grumbling about the condition?)
(2) Tight range plus several at best price: More often, especially with larger numbers of contracts, there’s a spread that includes a close range of offers, but a few of them are tied for the highest value or very close to it either within or above that range. Here’s how it could look visually.
With the example above, what I’ve seen happen is that most of the potential buyers are looking at the closed sales and deciding that they reflect current value. The others, though, understand that the closed sales reflect contracts which were most likely accepted at least 30 days ago, and are considering the trajectory of price appreciation. In other words, if home values are rising at the rate of X per month, they are mentally seeing where this price should be now. They are saying “let’s add 10% to the comps to get to today’s value” or some such formula. These multiple highest bidders are the ones who understand the market when it’s moving up fast. (more…)
Typically when houses or condos sell for more than the list price in Silicon Valley, it’s an indicator that there were multiple offers.
But not always.
Once in awhile, a property has been priced a little on the low side, specifically because the sellers and their agent wanted more than one bid. If only one offer is presented, it could come in higher than the list price because more competition was expected. Or if it were full price or under, the sellers could still counter offer it to where they are willing to sell it.
You may be thinking, perhaps indignantly, “Don’t they have to sell their property for the list price? That’s the advertised price!” The short answer is no, they don’t have to sell it for any price at all.
Of course, putting your property on the market with a deceptively low price – meaning one you don’t intend to take – is a strategy that can backfire and create ill-will. It’s a risk, and not one I’d recommend.
Our MLS does not track how many contracts a house, condo or townhouse gets. Sometimes the listing agents kindly put comments in the private agent remarks to give that info,and perhaps appreciation for everyone who tried, such as “20 offers received, thanks to all for your hard work!” The usual way to find this information out is to call, text or email the listing agent. Understandably, if they got dozens of bids, you’re unlikely to hear back unless yours was one of them.
So once again, there aren’t any “easy answers” here. Most of the time, a higher sales price to list price ratio means multiple offers. But it is possible that it was a sale that happened with just one very driven buyer. Just this last week, one San Jose home sold 4% over list with merely one offer. Home buyers in Santa Clara County often expect to pay more than list price when it’s multiples, but not so much if you’re the only bidder. Time to adjust – you may be paying more than list price even if you’re the only one with a purchase agreement in hand.
Related reading on Silicon Valley real estate sales prices & multiple offers:
Helping nice folks to buy and sell homes in Silicon Valley
Mary Pope-Handy, Realtor ABR, CIPS, CRS, SRES
Christie's International Real Estate Sereno, Los Gatos, CA 95030 408 204-7673 Mary@PopeHandy.com License# 01153805
Clair Handy, Realtor
GREEN
Christie's International Real Estate Sereno 214 Los Gatos-Saratoga Rd Los Gatos, CA 95030 ClairHandy@sereno.com License# 02153633
Mary & Clair sell homes throughout Silicon Valley: Santa Clara County, San Mateo County, and Santa Cruz County. with a special focus on: San Jose, Los Gatos, Saratoga, Campbell, Almaden Valley, Cambrian Park.
The real estate search
Use this link to browse properties which are for sale, under contract (pending) or sold. Want to view only homes which are available now?
Mary Pope-Handy, Realtor ABR, AHWD, CIPS, CRS, SRES Christie's International Real Estate Sereno DRE License #01153805 408-204-7673 mary@popehandy.com “Helping nice folks to buy and sell homes in Silicon Valley since 1993”
Clair Handy, Realtor, GREEN Christie's International Real Estate Sereno DRE License #02153633 408-721-6160 clairhandy@sereno.com “Helping nice folks to buy and sell homes in Silicon Valley”
This is the Valley of Heart's Delight blog , covering Silicon Valley real estate - Santa Clara County, San Jose, Los Gatos, Cupertino, and nearby communities in the South Bay Area and lower Peninsula. Find info on neighborhoods, disclosure issues, buyer and seller tips, and housing market conditions in the west valley and most of the county.Please also see my other websites and real estate market statistics site, which are listed in the sidebar, above.
Sitemap
SanJoseRealEstateLosGatosHomes.com
Mary Pope-Handy, Realtor ABR, CIPS, CRS, SRES Sereno DRE License #01153805 408-204-7673 mary@popehandy.com
“Helping nice folks to buy and sell homes in Silicon Valley since 1993”